
FloorViewWhite-label product · live with a client
Live sales by branch, team and category — on the ERP you already run
A chain that tracks the day in spreadsheets finds out how the day went once it is over. This is the management cockpit and the shop-floor screen that put the same live numbers in front of the people running the business and the people making the sale.
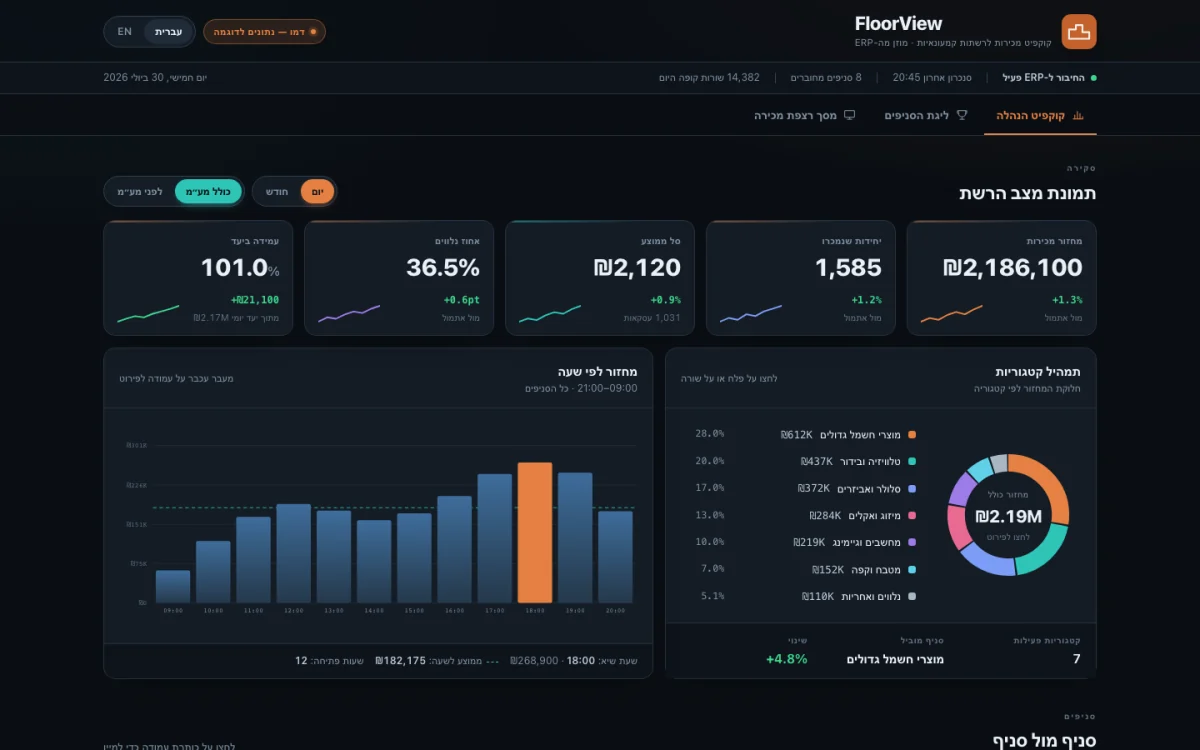
Sample data, white-labelled. The client system is private.
Every till in a chain already records the sale. The problem was never measurement — it is that the measurement lands inside a system built for taking orders, and only comes back out as a file somebody assembles.
That costs twice. Management has no shared view: two people comparing branches are comparing two exports taken at two different moments, so the argument is about the file rather than about the number. And the inter-branch competition — the thing that actually changes behaviour on the floor — is maintained manually, which means the standings are always a day behind the day they are supposed to drive.
Meanwhile the person closest to the sale has nothing in front of them at all. A salesperson finishes a shift without knowing whether the branch is ahead or behind, and knows nothing about the customer standing there beyond what the customer volunteers.
Two audiences, one set of numbers, and no assembled file anywhere in the middle.
One source, not an export
Everything reads live from the company’s own ERP. There is no intermediate file, so there is nothing to reconcile and no version of the numbers that is older than another version of the numbers.
The management cockpit
Revenue by branch, by team and by category, with a toggle for the ex-VAT view — because that is how the business talks about its own numbers internally, and a dashboard that forces a translation gets ignored.
The competition engine
Inter-branch standings computed from the same live data. It replaced a spreadsheet the chain manager maintained manually, which means the standings are now exactly as current as the sales that produced them.
Screens for the floor
A rotating display: four daily and monthly podiums with a motivation board between them, written for someone glancing at it between customers rather than sitting in front of it.
A customer panel
The salesperson gets a short Hebrew brief drawn from that shopper’s own purchase history — what they buy, and what is reasonable to put in front of them next.
Hebrew, right to left, from the first screen
Written in Hebrew and laid out right-to-left throughout, down to the direction of the figures. Staff notice the difference immediately, even when they cannot name what it is.
No vendor names, deliberately — what matters is the surfaces, not the parts.
- 01Live sales data from the company’s own ERP
- 02The branch, team and category structure the business already uses
- 03An ex-VAT view alongside the gross one
- 04Customer purchase history, per shopper
- 05Always-on display screens on the sales floor
- 06A management console behind them
A chart is quick. A cockpit over live operational data is not, and the cost is almost never in the charting. It is in reconciling what the business means by a “team”, a “category” and a “day” with how the source system happens to store those things — a difference that only becomes visible when two people read the same screen and disagree.
The second cost is that this is two products over one data model. A management console and a screen someone glances at from four metres away have different rules about density, refresh and what may be left out, and building one and shrinking it does not produce the other.
The figures this system displays belong to the business running it, so none of them are published here. What is published is what it does.
Live on real ERP data since June 2026 and still in active development. It exists as a white-label product, so the same cockpit can be rebuilt on another chain’s data.
Does this describe your operation?
Five to ten minutes on the phone is enough to tell whether the same shape of system fits what you are running — or whether it does not.
Free · 5–10 minutes · no obligation